


Collect logs and monitor network with Wyse3040 (Grafana+Loki+Promtail)
This article is a translation of the following my article:
Original: Wyse3040でログ収集・ネットワークを監視する(Grafana+Loki+Promtail)
* Translated automatically by Google.
* Please note that some links or referenced content in this article may be in Japanese.
* Comments in the code are basically in Japanese.
by bokumin
Logging and network monitoring on Wyse3040 (OS:OpenSUSE)
Introduction
Wyse 3040 Thin Client was on sale for 2500 yen, so I bought it.
The storage is 8GB of eMMC, but it is a device that can point to 4 USB ports.
I thought about just using it as a file server, but I thought it would be interesting to use it as a device to collect logs and monitor the network at home, so I decided to create it this time.
2025/11/19 Currently, I have installed FreeBSD on Wyse3040 and am using it as a simple surveillance camera. I have written a separate article about that, so I hope you find it helpful.
Wyse 3040 Thin Client BIOS settings
In my case, for some reason the BIOS did not start up even when I pressed the power button, so I cleared the CMOS. When you open the inside, there is a button called CMOS CLEAR, so press that to clear the CMOS.
Once booted, press F2 repeatedly to enter the BIOS screen. The default password is Fileport.
*The BIOS is locked, so use this password to unlock it for the first time.
Then, turn on Enable USB Boot and disable Secure Boot on the BIOS screen.
Reference: https://qubitsandbytes.co.uk/install-a-new-os-on-a-dell-wyse-3040/
OpenSUSE installation
All the servers at home are OpenSUSE, so I installed OpenSUSE, which is personally easy to use.
I downloaded it from the URL below and put it in a USB.
https://get.opensuse.org/ja/leap/15.6/
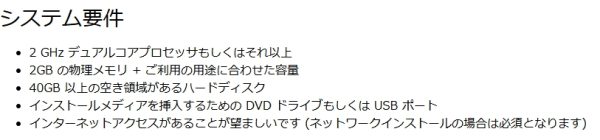
Looking at the system requirements, you can see that the hard disk is at least 40GB, which is definitely not enough, but if you meet the minimum requirements, you can install it without any problems.
localhost:/etc/loki # sudo zypper install neofetch
localhost:/etc/loki # neofetch
                 `-++:`                    hogehoge@localhost
               ./oooooo/-                  ------------------
            `:oooooooooooo:.               OS: openSUSE Leap 15.6 x86_64
          -+oooooooooooooooo+-`            Host: Wyse 3040 Thin Client
       ./oooooooooooooooooooooo/-          Kernel: 6.4.0-150600.21-default
      :oooooooooooooooooooooooooo:         Uptime: 3 days, 20 hours, 52 mins
    `  `-+oooooooooooooooooooo/-   `       Packages: 810 (rpm)
 `:oo/-   .:ooooooooooooooo+:`  `-+oo/.    Shell: bash 4.4.23
`/oooooo:.   -/oooooooooo/.   ./oooooo/.   Terminal: /dev/pts/0
  `:+ooooo+-`  `:+oooo+-   `:oooooo+:`     CPU: Intel Atom x5-Z8350 (4) @ 1.920GHz
     .:oooooo/.   .::`   -+oooooo/.        GPU: Intel Atom/Celeron/Pentium Processor x5-E8000/J3xxx/N3xxx
        -/oooooo:.    ./oooooo+-           Memory: 452MiB / 1885MiB
          `:+ooooo+-:+oooooo:`
             ./oooooooooo/.
                -/oooo+:`
                  `:/.
You can see that Leap has been successfully installed.
Next, we will install Loki, Promtail, and Rsyslog for network management.
Installing Loki
*The version of Loki and Promtail is specified as 2.8.7, but I think there is no problem with the latest version.
sudo zypper refresh
# 必要なパッケージのインストール
sudo zypper install rsyslog wget

# Lokiのインストール(github)
wget https://github.com/grafana/loki/releases/download/v2.8.7/loki-linux-amd64.zip
unzip loki-linux-amd64.zip
chmod +x loki-linux-amd64

# Lokiを /usr/local/bin に移動
sudo mv loki-linux-amd64 /usr/local/bin/loki
Let’s create a configuration file for Loki.
# Lokiの設定ファイル作成
sudo mkdir -p /etc/loki
sudo nano /etc/loki/config.yaml
auth_enabled: false

server:
  http_listen_port: 3100
  grpc_listen_port: 9096

common:
  path_prefix: /var/lib/loki
  storage:
    filesystem:
      chunks_directory: /var/lib/loki/chunks
      rules_directory: /var/lib/loki/rules
  replication_factor: 1
  ring:
    instance_addr: 127.0.0.1
    kvstore:
      store: inmemory

schema_config:
  configs:
    - from: 2024-12-14
      store: boltdb-shipper
      object_store: filesystem
      schema: v11
      index:
        prefix: index_
        period: 24h

storage_config:
  boltdb_shipper:
    active_index_directory: /var/lib/loki/boltdb-shipper-active
    cache_location: /var/lib/loki/boltdb-shipper-cache
    cache_ttl: 24h
    shared_store: filesystem
  filesystem:
    directory: /var/lib/loki/chunks

limits_config:
  reject_old_samples: true
  reject_old_samples_max_age: 168h # 1週間のログ保持
Next, we will create files related to Loki’s system services.
sudo mkdir -p /var/lib/loki
sudo chown -R $USER:users /var/lib/loki
# Systemdサービスファイル作成
sudo nano /etc/systemd/system/loki.service
[Unit]
Description=Loki Log System
After=network.target

[Service]
Type=simple
User=root
ExecStart=/usr/local/bin/loki -config.file=/etc/loki/config.yaml
Restart=on-failure

[Install]
WantedBy=multi-user.target
Rsyslog configuration file change
Instead of sending the Rsyslog log directly to Loki, this time I configured it to output the log to var and then give it to Promtail.
sudo mkdir -p /var/log/rsyslog

# /etc/rsyslog.confの最終行に以下を追加
template(name="LocalLogs" type="string" string="/var/log/rsyslog/%hostname%/%$YEAR%-%$MONTH%-%$DAY%.log")
*.* action(type="omfile" DynaFile="LocalLogs" template="RSYSLOG_FileFormat")
I was afraid that too many Rsyslog logs would accumulate, so this time I added the following line directly to cron.
# VISUAL=nano crontab -e
0 0 * * 0 find /var/log/rsyslog/ -type f -mtime +7 -delete
Installing Promtail
We will also install Promtail. The installation method is almost the same as Loki.
# Promtailのインストール(github)
wget https://github.com/grafana/loki/releases/download/v2.8.7/promtail-linux-amd64.zip
unzip promtail-linux-amd64.zip
chmod +x promtail-linux-amd64

# Promtailを /usr/local/bin に移動
sudo mv promtail-linux-amd64 /usr/local/bin/promtail
Let’s create a configuration file for Promtail.
sudo mkdir -p /etc/promtail
sudo nano /etc/promtail/config.yaml
The basic configuration file for Promtail is written as follows.
The Rsyslog log file mentioned earlier is sent to loki.
server:
  http_listen_port: 9080
  grpc_listen_port: 0
positions:
  filename: /tmp/positions.yaml
clients:
  - url: http://localhost:3100/loki/api/v1/push
scrape_configs:
- job_name: 'rsyslog'
  static_configs:
  - targets:
      - localhost
    labels:
      job: rsyslog
      __path__: /var/log/rsyslog/*/*/*.log
Let’s create files related to Promtail’s system services.
[Unit]
Description=Promtail service
After=network.target

[Service]
Type=simple
User=root
ExecStart=/usr/local/bin/promtail -config.file /etc/promtail/config.yaml

[Install]
WantedBy=multi-user.target
Installing Grafana
Let’s install Grafana.
sudo zypper addrepo https://packages.grafana.com/oss/rpm-stable/opensuse/stable grafana
sudo rpm --import https://packages.grafana.com/gpg.key

sudo zypper refresh

sudo zypper install grafana
Click Connections in the left sidebar and select Add new connection.
Select the desired data source (Loki in this case) and enter the connection settings (http://localhost:3100 (default port for Loki))
Then enable all systems. Please check whether there are any errors using journalctl or systemctl status.
sudo systemctl daemon-reload
# Lokiを有効化
sudo systemctl enable loki
sudo systemctl start loki
# Rsyslogの有効化
sudo systemctl enable rsyslog
sudo systemctl start rsyslog
# Promtailの有効化
sudo systemctl enable promtail
sudo systemctl start promtail
# Grafanaの有効化
sudo systemctl enable grafana.service
sudo systemctl start grafana.service
The basic settings are now complete. Next, we will create additional log files that we want to retrieve with Promtail.
Getting logs from another server
As for acquiring logs from another server, I think there are various ways to do so.
This time, I personally decided to use the simplest scp command to obtain the information.
# 私のものは既にインストールされていたが、もしされていなければ行う
sudo zypper install openssh

# 鍵の生成
ssh-keygen -t rsa -b 4096
ssh-copy-id hogehoge@remote-server
After that, use scp to obtain the log file you want to obtain.
*Normally, log files can only be accessed by root or limited users, so permissions need to be changed. You need to use chgrp or chmod to change the permissions to suit you.
I created a script using Apache log files as an example. Similar to Rsyslog, it is saved once under var.
#!/bin/bash
REMOTE_HOST="remote-server"  # ipアドレスもしくはドメイン
REMOTE_USER="hogehoge" # ユーザー名

SSH_KEY_PATH="/home/username/.ssh/id_rsa" # 鍵の場所


# 取得したいサーバー側のログ
LOGS=(
    "/var/log/apache2/access_log"
    "/var/log/apache2/access_default.log"
    "/var/log/apache2/access_default_ssl.log"
)

# Wyseで保存する場所
LOCAL_LOG_DIR="/var/log/apache2"

sync_log_file() {
    local log_path=$1
    local filename=$(basename "$log_path")

    scp -i "${SSH_KEY_PATH}" -q "${REMOTE_USER}@${REMOTE_HOST}:${log_path}" "${LOCAL_LOG_DIR}/${filename}"
    chmod 744 "${LOCAL_LOG_DIR}/${filename}"

    if [ $? -eq 0 ]; then
        echo "Successfully synced: ${filename}"
    else
        echo "Failed to sync: ${filename}"
    fi
}

main() {
    mkdir -p "${LOCAL_LOG_DIR}"

    for log in "${LOGS[@]}"; do
        sync_log_file "$log"
    done
}

main
Get router log file
I use an Elecom Wifi router at home. In that case, logs can be obtained using the following command.
# ルーターのログファイル取得
wget http://admin:[email protected]/others/save_log.sh -O /var/log/router.log
You can add this to the Apache log acquisition script mentioned earlier, or you can run it separately.
If you are using another router, please refer to the specifications when creating your own.
Setting example
For reference, I will post my Promtail settings.
This time, I tried to get web server logs, router logs, and Rsyslog logs.
server:
  http_listen_port: 9080
  grpc_listen_port: 0
positions:
  filename: /tmp/positions.yaml
clients:
  - url: http://localhost:3100/loki/api/v1/push
    tenant_id: ""
    batchwait: 1s
    batchsize: 1024000
scrape_configs:
  - job_name: bokumin45_webserver
    file_sd_configs:
      - files:
          - /etc/promtail/targets/*.yml
        refresh_interval: 5m
  - job_name: router_syslog
    static_configs:
      - targets:
          - localhost
        labels:
          job: router_syslog
          __path__: /var/log/router.log
  - job_name: 'rsyslog'
    static_configs:
      - targets:
          - localhost
        labels:
          job: rsyslog
          __path__: /var/log/rsyslog/*/*/*.log
The yml file in the targets directory is as follows.
# cat bokumin45.yml
- targets:
    - localhost
  labels:
    job: bokumin45_access
    __path__: /var/log/apache2/access_log

- targets:
    - localhost
  labels:
    job: bokumin45_access_default
    __path__: /var/log/apache2/access_default.log

- targets:
    - localhost
  labels:
    job: bokumin45_access_default_ssl
    __path__: /var/log/apache2/access_default_ssl.log
Described how to build a network monitoring system using Wyse3040. A file server is also good, but I hope this will be helpful for those who don’t want to go through the trouble of preparing storage.
There are still a few units left in stock, so if you are interested, please try purchasing one.
Dell Wyse 3040 Thin Client Product page:https://ut-pcmobile.easy-myshop.jp/c-item-detail?ic=A000000020
追記
The lifespan of eMMC is quite short compared to HDD and SSD. Therefore, I think Wyse3040 will last longer if the part below var (log file) is stored in other storage.
The article below describes how to migrate a specific directory to another storage using OpenSUSE, so I hope you find it helpful.